Description
TABLE OF CONTENTS
1.0 Global Strategic Overview
Fig 1 Global Light Vehicle Registrations by Region 2019-2022
Fig 2 Global Light Vehicle Registrations by Region Forecast to 2028
Fig 3 Impact of CASE Trends on Future Tire Demand
2.0 European Light Vehicle Registration & Parc Forecasts to 2028
Fig 4 Quarterly Change in New Registrations by Country to Q4-2022
Fig 5 European Light Vehicle Registrations by Country Forecast to 2028
Fig 6 Indexed trends in European Personal Mobility from 2000 to 2022
Fig 7 Vehicle Kilometres Travelled (VKMT), Cars & LCV, 2000 to 2022
Fig 8 European Light Vehicle Parc by Region Forecast to 2028
Fig 9 European Light Vehicle Parc by Country Forecast to 2028
Fig 10 European Light Vehicle Parc Density by Region Forecast to 2028
Fig 11 European Light Vehicle Parc Density by Country 2018-2022
3.0 European Tire Market Forecasts to 2028
Fig 12 European Original Equipment and Replacement PCLT Tire Segments Forecast to 2028
Fig 13 European Original Equipment and Replacement PCLT Tire Volume by Country Forecast, 2028
Fig 14 Share of OE and Replacement PCLT Tire Volumes by Country Forecast, 2028
Fig 15 Market Potential – Tires for Plug-In Electric Cars in Europe to 2030
4.0 European Original Equipment Tire Market Forecasts to 2028
European OE Tire Market Development
European OE Tire Market Developments by Vehicle Manufacturer
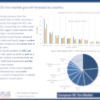
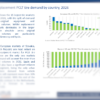
Fig 16 European OE PCLT Tire Volume by Country 2019-2022
Fig 17 European OE PCLT Tire Volume by Region Forecast to 2028
Fig 18 European OE PCLT Tire Volume by Country Forecast to 2028
Fig 19 Share of European OE PCLT Tire Volume by Country 2028
European OE Tire Market Development by Country (Germany, Spain, France, Italy)
European OE Tire Market Development by Country (United Kingdom)
European OE Tire Market Development by Country (Czech Republic, Slovakia, Hungary, Poland, Romania)
European OE Tire Market Development by Country (Russia)
5.0 European Replacement Tire Market Forecasts to 2028
Fig 20 European Replacement PCLT Tire Volume by Country 2019-2022
Fig 21 European Replacement PCLT Tire Volume by Region Forecast to 2028
Fig 22 European Replacement PCLT Tire Volume by Country Forecast to 2028
Fig 23 Share of European Replacement PCLT Tire Volume by Country 2028
Fig 24 Value of the European Replacement PCLT Tire Market
Fig 25 Market Segmentation, Summer, Winter and All-Season Tires
Fig 26 European Replacement PCLT Tire Volume by Rim Diameter Forecast to 2028
Fig 27 Segmentation of ≥18″ European Replacement Tire Volumes Forecast to 2028
6.0 European PCLT Tire Capacity Forecasts to 2028
Fig 28 European PCLT Tire Manufacturing Capacity by Region 2013-2028
Fig 29 Share of European PCLT Tire Manufacturing Capacity by Region 2013-2028
Fig 30 European PCLT Tire Manufacturing Capacity by Country, 2013 & 2028
Fig 31 Net Change in European PCLT Tire Manufacturing Capacity by Country, 2013-2028
Fig 32 PCLT Tire Manufacturing Capacity in Central & Eastern Europe, 2013-2028
Fig 33 PCLT Tire Manufacturing Capacity in Western Europe, 2013-2028
Fig 34 Share of PCLT Tire Manufacturing Capacity by Country, 2022
Fig 35 Average PCLT Tire Plant Capacity Region, 2013-2028
Fig 36 Average PCLT Tire Plant Capacity Country, 2013 & 2028
7.0 European PCLT Tire Capacity Forecasts by Company to 2028
Fig 37 Net Change in European PCLT Tire Manufacturing Capacity by Company, 2013-2028
Fig 38 Net Change in European PCLT Tire Manufacturing Capacity by Company, 2013-2023 and 2023-2028
Fig 39 European PCLT Tire Manufacturing Capacity by Company, 2013-2028
Fig 40 Net Change in European PCLT Tire Manufacturing Capacity by Company and Region, 2013-2028
Fig 41 PCLT Tire Manufacturing Capacity by Company and Region, 2013-2028
8.0 Western & Central European PCLT Tire Supply Balances
Fig 42 Western & Central European PCLT Tire Production & Capacity Utilisation, 2016-2022
Fig 43 Western & Central European PCLT Tire Supply Balances, 2016-2022
Fig 44 EU-27+UK PCLT Tire Imports (share), 2019-2022
Fig 45 EU-27+UK PCLT Tire Imports by Source, 2015-2022
Fig 46 EU-27+UK PCLT ‘Near-sourced’ Tire Imports, 2015-2022
9.0 Russia and Eastern European PCLT Tire Supply Balances
Fig 47 PCLT Tire Demand in Eastern Europe, 2016-2022
Fig 48 PCLT Tire Demand in Russia by Segment, 2012-2022
Fig 49 Tire Production in Russia by Segment 2012-2022
Fig 50 PCLT Tire Capacity Utilisation in Russia, 2012-2022
Fig 51 Structure of PCLT Tire Manufacturing Capacity in Eastern Europe, 2007-2028
Fig 52 Share of Competitors Capacity located in Russia, 2022
Fig 53 Export Share of Competitors PCLT Tire Production in Russia
Fig 54 Share of PCLT Tire Manufacturing Capacity in Russia by Competitor, 2022
Fig 55 Change in Russia PC Tire Production by Month, 2022
Fig 57 Russian PCLT Tire Exports, 2012-2021
Fig 57 Russian PCLT Tire Exports by Destination, 2016-2021
10.0 Data Tables
Table 1 European Original Equipment Tire Market Demand By Region and Country 2018-2028
Table 2 Growth in European Original Equipment Tire Market Demand By Region and Country 2018-2028
Table 3 Share of European Original Equipment Tire Market Demand By Region and Country 2018-2028
Table 4 European Replacement Tire Market Demand By Region and Country 2018-2028
Table 5 Growth in European Replacement Tire Market Demand By Region and Country 2018-2028
Table 6 Share of European Replacement Tire Market Demand By Region and Country 2018-2028
Table 7 European New Vehicle Registrations by Region and Country 2018-2028
Table 8 European Light Vehicle Parc by Region and Country 2018-2028
11.0 Glossary and Definitions
TABLE OF CONTENTS – EXCEL DATA PACK
Europe – Original Equipment PCLT Tire Market Forecast
Europe – Replacement PCLT Tire Market Forecast
Europe – PCLT Tire Production Capacity Forecast
Europe – New Light Vehicle Registrations


