Metropolitan Police fleet tyre demand
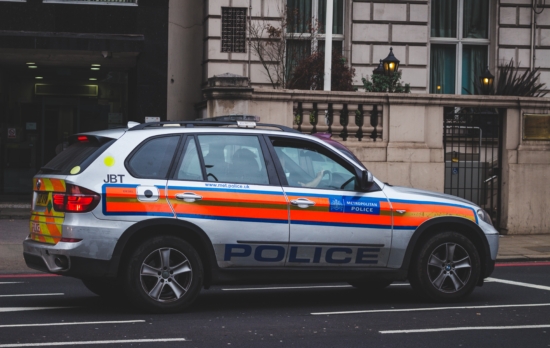
 Photo: Dom J; Pexels
As part of the Fleet feature within the June edition of Tyres & Accessories, we investigated the various tyre demands of leading Police fleets. Amongst other things, we found that Kent Police are the most tyre-hungry and that – despite being contracted to basically two manufacturers under the Crown Commercial Service agreement – such fleets are actually surprisingly open to competing tyre manufacturers. With this in mind, and continuing our series analysing Police fleet tyre preferences, this month we take a closer look at Metropolitan Police fleet tyre demand.
With 31,175 officers in 2019, London’s Metropolitan Police force is nearly twice the size of the next biggest force (Scotland – 17,251 officers) and comparable in size with the next four largest forces combined. And when you consider that the total UK Police force numbered 123,200 last year, the Metropolitan Police (or the Met as it affectionately known) represents roughly a quarter of total Police officers. The point is that while there are clearly regional variations around the country, the Met is such a large sample that it can be viewed as nationally representative.
As outlined in the opening article in this series, Tyres & Accessories obtained the Police tyre demand data following a series of Freedom of Information (FOI) requests during the first months of 2020. Responses differed greatly between the various constabularies, but in the case of the Met we were able to access raw tyre data from the last three years (2017, 2018 and 2019). We then extracted the data and performed a series of analyses which resulted in not only headline consumption figures, but also brand share and other details considered across three years.
Declining market
First off, tyre consumption. As big as it clearly is, Metropolitan police tyre consumption has actually decreased significantly in recent years. Back in 2017, London’s Police purchased 12,878 tyres. A year later it was 12,407. And in 2019 it was just 10,903 – almost 2000 tyres less than two years earlier. It is beyond the scope of this article to explain why that is, but it is more than likely the result of budget cuts that have resulted in comparable reductions in officer numbers. Whatever the reason, the result is the same – a 20 per cent reduction of market potential in this leading fleet, something that is also likely to be reflected in the national picture.

An increasingly open market
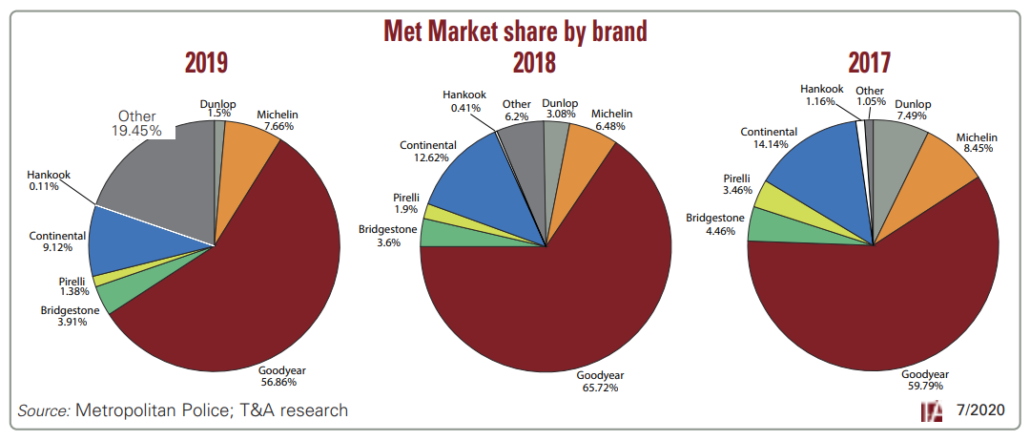
As we have seen, one of the major conclusions from the first article in this series was that the Crown Commercial Service contract is surprisingly open to competition. The two main beneficiaries of the deal clearly benefit, with Goodyear commanding over 56 per cent and Michelin 7.66 per cent in 2019. However, when you put this in context, there is actually a downward trend in both cases.
Goodyear, for example, had north of 59 per cent in 2017 and peaked at 65 per cent in 2018. Meanwhile Dunlop, which as we know resides in the Goodyear brand stable in the UK, occupied 7.49 per cent in 2017, but just 1.5 per cent in 2019. Therefore, the combined Goodyear group total share fell from 67 per cent in 2017 to 58 per cent in 2019. When you consider that the size of the fleet also fell by around a fifth during the period, these figures mark a significant reduction.
Meanwhile, the fleet has become markedly more open to competing brands. No major brands have won the lost market share, but rather the percentage of “other” has markedly increased. To be specific, Metropolitan police fleet tyre share was 98.95 per cent occupied by the top seven brands in 2017, but this fell to roughly 80 per cent in 2019. So, we have to assume that the lost share in the declining marketplace has been spread around the wide range of brands outside the top seven. And therefore, we must also conclude that the Metropolitan Police and UK Police tyre fleets in general – Crown agreement or not – have actually become markedly more open during the course of the last four-year contract.
| Metropolitan Police tyre share by brand 2019 | 2018 | 2017 | ||||||||
| Dunlop | 1.50% | Dunlop | 3.08% | Dunlop | 7.49% | |||||
| Michelin | 7.66% | Michelin | 6.48% | Michelin | 8.45% | |||||
| Goodyear | 56.86% | Goodyear | 65.72% | Goodyear | 59.79% | |||||
| Bridgestone | 3.91% | Bridgestone | 3.60% | Bridgestone | 4.46% | |||||
| Pirelli | 1.38% | Pirelli | 1.90% | Pirelli | 3.46% | |||||
| Continental | 9.12% | Continental | 12.62% | Continental | 14.14% | |||||
| Hankook | 0.11% | Hankook | 0.41% | Hankook | 1.16% | |||||
| Other | 19.45% | Other | 16.20% | Other | 1.05% | |||||
| Source: Metropolitan Police; T&A research | ||||||||||


Comments